

Reporting
Reporting is a useful tool in programming. It could be use for creating a report of a finished process, showing the user important data they can easily download or just wanting to save your data in a viewable and printable way. There are multiple ways to create reports. In this blog I will be talking about using JasperReports.
JasperReports is an open source java reporting tool that can export created reports to a variety of extensions. It is a Java class library and is meant for Java developers who need to create reports.
Overview
I will show you how to create a basic report in Jaspersoft Studio using templates and a Sample DB. Both of which are provided by JasperSoft. I will not go into details of how everything works in this blog as that will be covered in part 2.
Installation
To start using JasperReports you will need an application capable of generating the reports. Two of the more popular ones are iReport(deprecated) and JaspersoftStudio.
JaspersoftStudio
To get started with JaspersoftStudio we will have to create a new report. By clicking on File -> New -> Jasper Report you will be greeted by a wizard that will help you setup a new report. You may choose one of the predefined templates or start with a blank page. You will also be asked what data source to use, for now you can choose any data source and change it later after you created a new one.
Data source
- A data source in JasperReports represents a database connection that will be used to get the data needed to populate the report. You can create a new data source by creating a data adapter and choosing the option that suits you best.
For this example I have created a report using the coffee template and used the Sample DB data source that Jasper provides. Now you should be able to see your JasperReport and some other things like properties, settings and the pallet. But for not lets focus on the following.
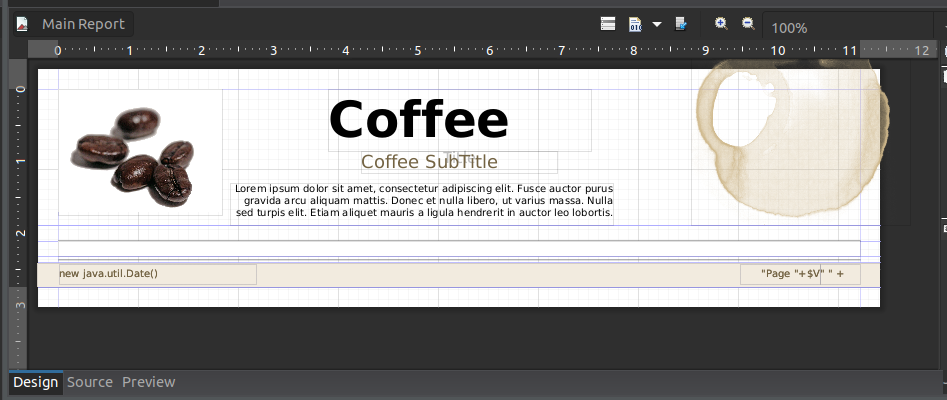
Design - The design tab holds the actual design of out report. Here we can see how it looks without any data, we can move data using the Ui or by changing the properties. We can add new elements to the report or delete existing ones.
Source - JasperReport is actually a jrxml file that contains the design of the report and its functionalities. This tab holds the jrxml code aka the source code of the JasperReport. You can edit this file directly and the changes will be reflected in the Design tab.
Preview - When you want to check how your report will look you can click on the Preview tab, fill out all the parameters, if you set any, and click the run button.
Looking on the left side of the screen you can notice an Outline window.
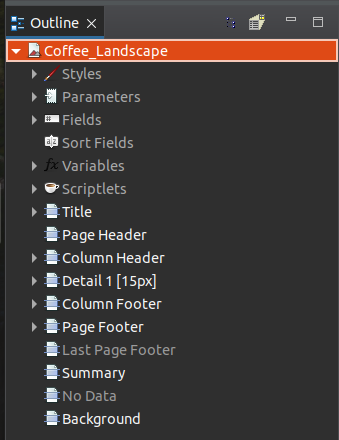
This window is used as a way to select the elements in the report without having to click them in the Design of the report. If you were to click an element in the Design of the report it would be selected in the Outline window. All of the elements below title, including it, are called bands. Bands are sections of the report and there are nine of them but you are able to add multiples of some bands (for example it is common to have multiple Details bands).
Aside from the bands the other important elements here are the Parameters and Fields.
Parameters - Parameters are values passed by the user to the JasperReport and they are used to manipulate the data used in a specific way. For example lets say you want to get all products whose price is between two variables you have in code. You can pass those variables as Parameters and use them in your sql query.
Fields
- Fields are the values returned from the sql query. For example if you selected a products ID, name and costs to show in the report, they would be saved to Fields. After clicking on any item, either in the Outline window or the Design tab, it's properties will appear on the right side of the screen.
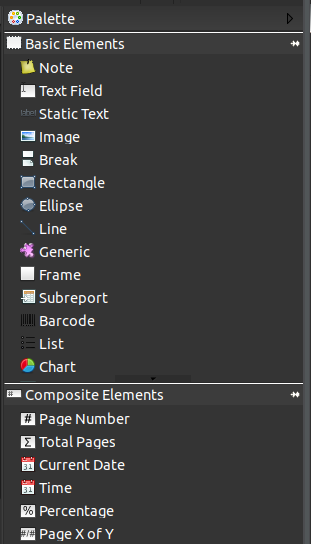
On the right side we also have the pallet which holds all of the elements which can be placed in the report. I will go through these in more detail in part 2.
If I ran the report right away I would get an error because I did not setup the data source correctly. I choose the Sample DB but I never told Jasper what fields to read. To add an sql query to a report click on the report name in the Outline window, in my case the Coffee Landscape one. Then in the properties window click on the Edit query button. This opens the Dataset and Query Dialog popup.
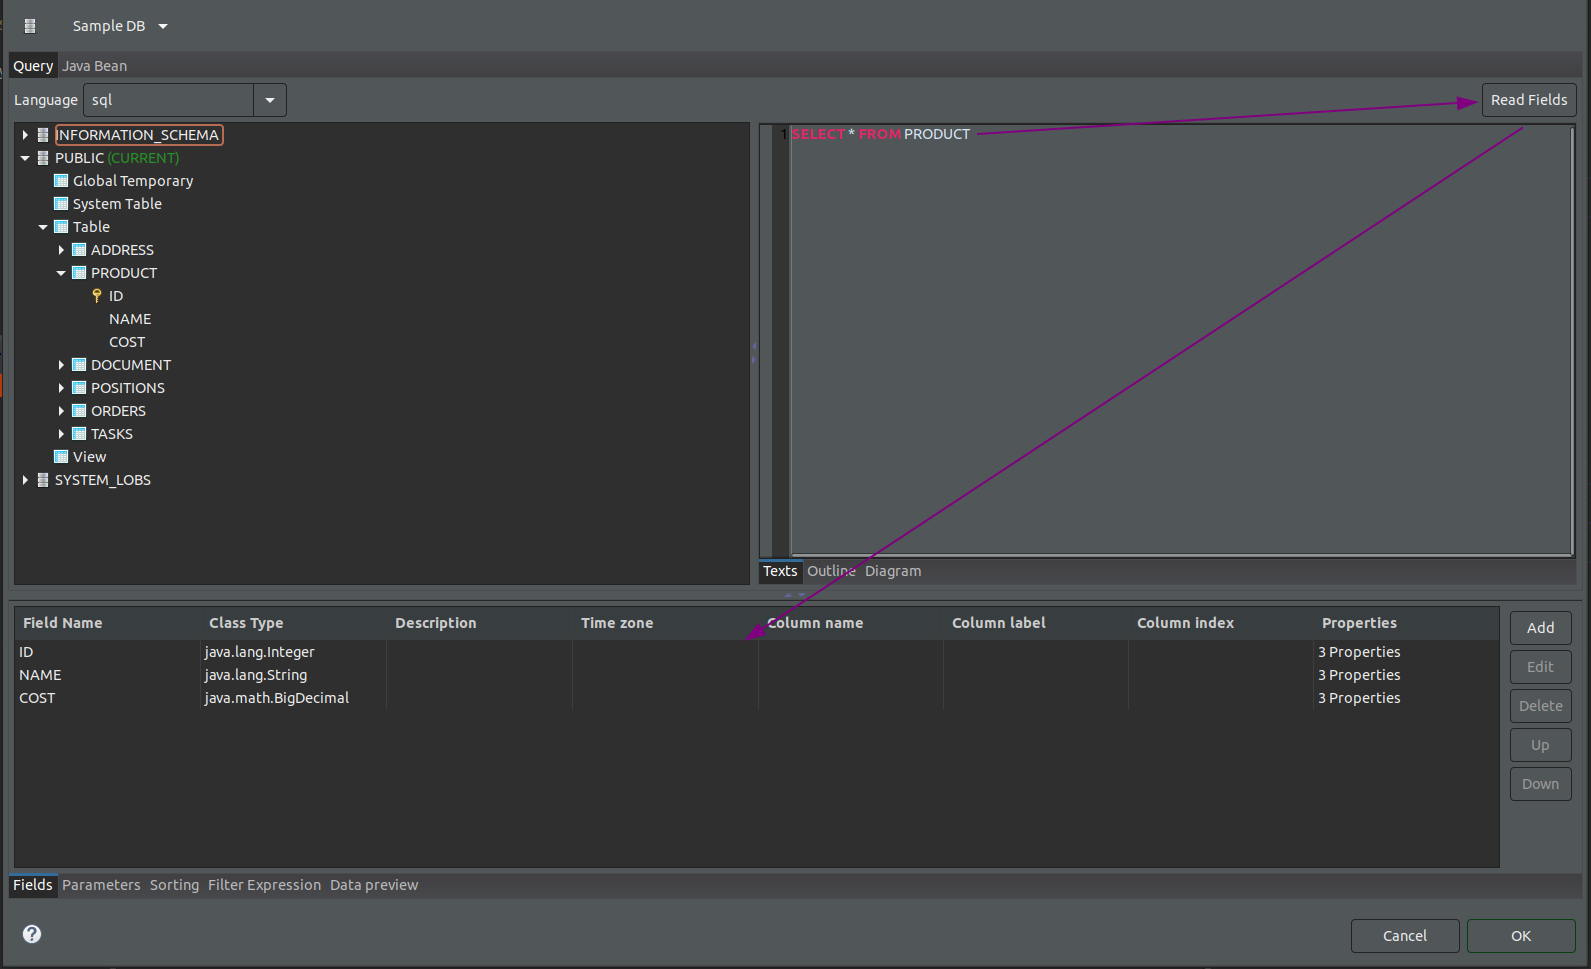
On the left side is our database that we are connected to, on the right side we can type a query and click the Read Fields button. This will populate our Fields to use in the report.
Note: You can use parameters here by typing $P{PARAM_NAME}. If you created a parameter wit the name MaximumCost then you can use it as "WHERE cost <= $P{MaximumCost}".
Tip: Before using any parameters write the SELECT and FROM clause of the query and Read Fields as you won't be able to Read Fields if using parameters in the query.
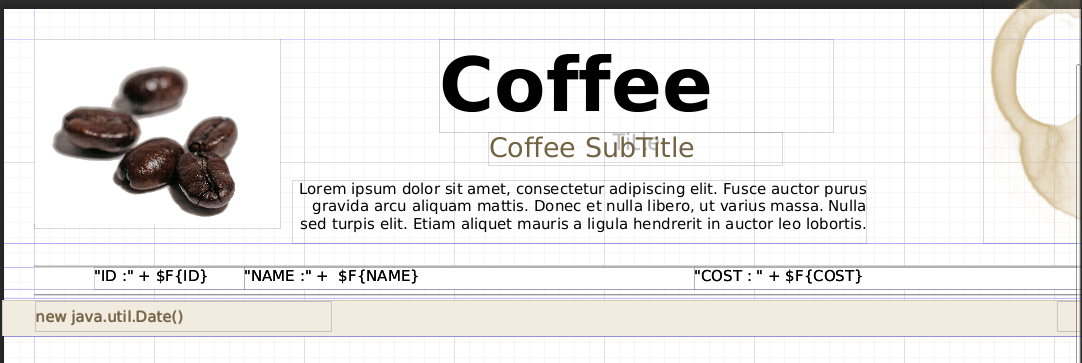
After clicking OK and saving the query we can check and see that our Fields now has values inside of it. Showing these values can be done in many ways. Either by showing them as lists, tables, basic text or some custom variation. I will be showing them as basic text. Luckily the template I used already added the detail band and created a frame inside of it. So I will be adding three text field, one for each field returned by the query, to that frame. I can do this by drag dropping it from the pallet
Frame: An element that can contain other elements
To add the text field to the report I will just drag and drop the text field element from the pallet onto the frame in the Design tab. Next I will set its height to be equal to the frames height, set the width I want that element to have. I can set these settings by dragging the element in the Design tab and resizing it or I can just type the values I want it to have in the elements properties. Using a field from Fields is similar to using a parameter, instead of using $P it's $F. In the end my report looks something like this:
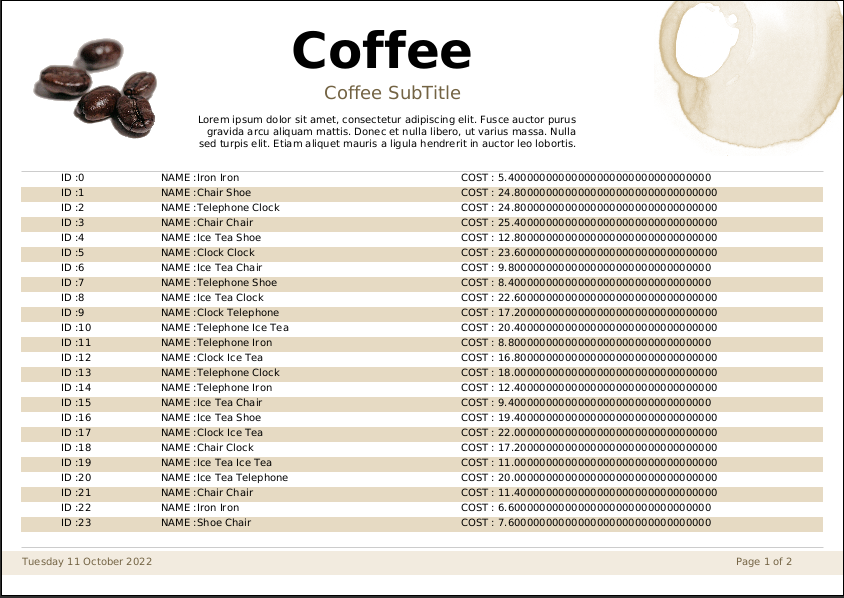
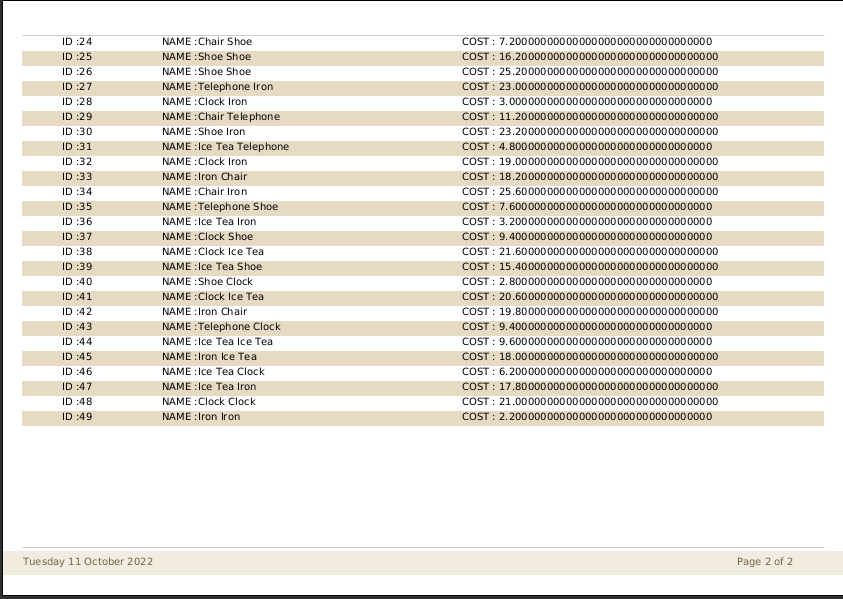
Running the Preview generates the report:
Conclusion
Jasper Reports can be used to easily create reports. As this blog shows you can create a working basic report in only minutes. Stay tuned for more complex reports, working with tables, detailed explanations for bands and elements in part 2.


